

As we move through the latter half of 2025, Bitcoin continues to trace the upper bounds of its historical power curve — a price structure that has, cycle after cycle, proven a reliable guide to long-term market behavior. But where exactly are we now?
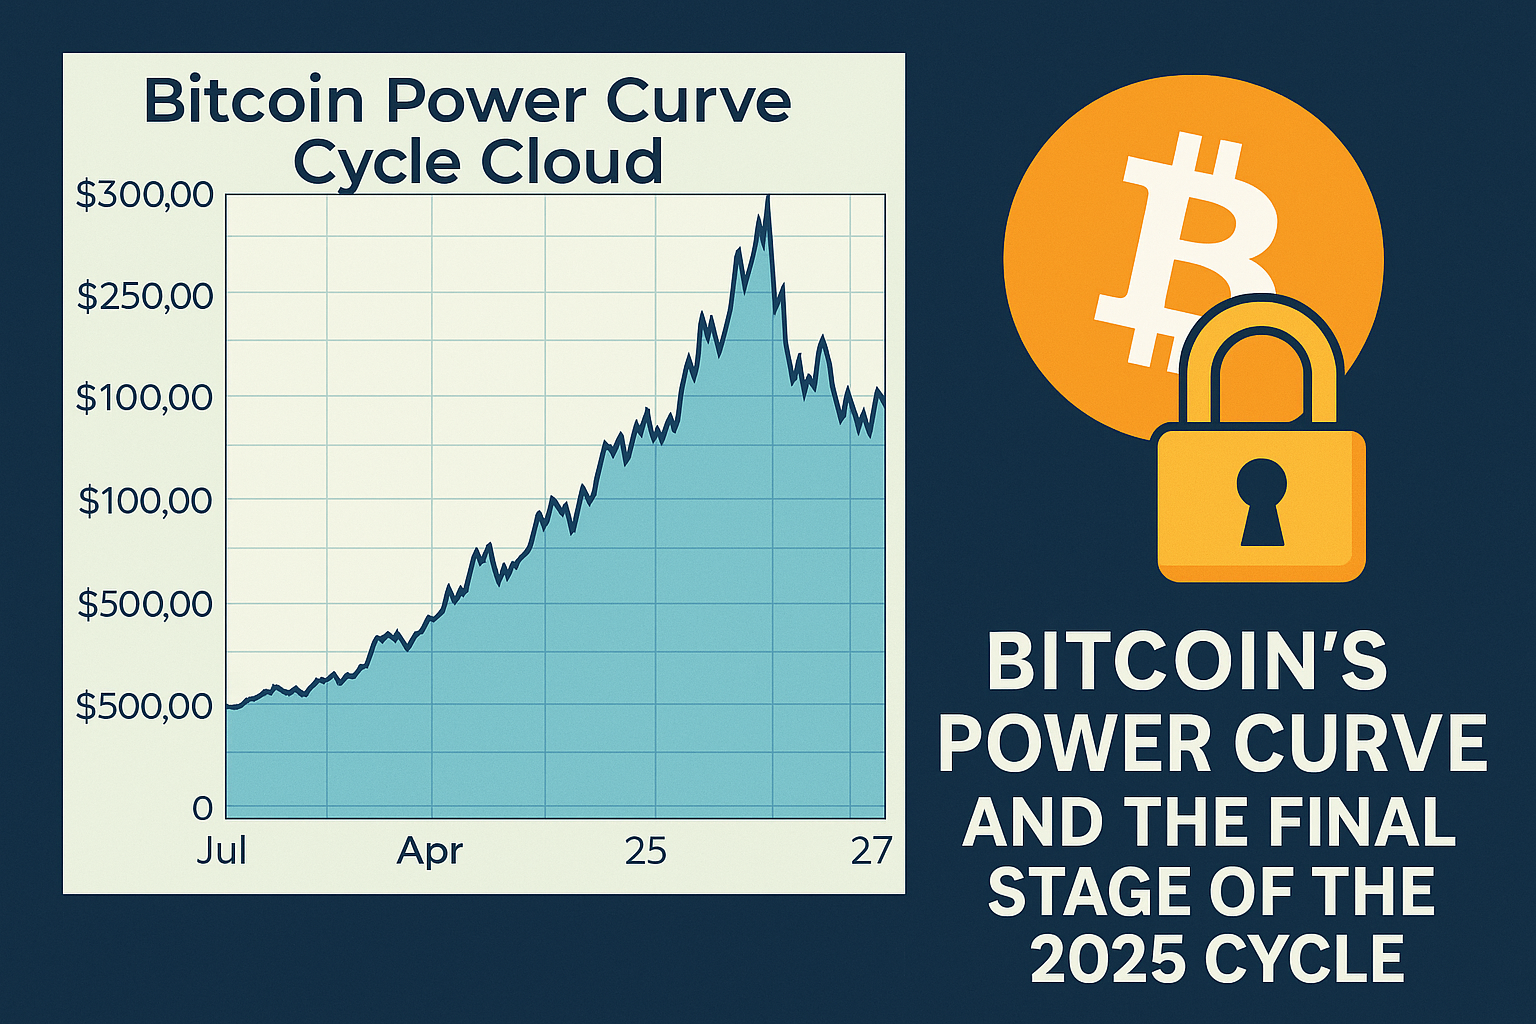
According to multiple metrics and models — especially the Power Curve Cycle Cloud (see Image 1) — we’re approaching a confluence of opportunity and caution. Historically, Bitcoin's peak comes in November or December, like clockwork:
- 29 Nov 2013 — $1,242
- 17 Dec 2017 — $19,804
- 10 Nov 2021 — $68,997
If this cycle holds, Nov–Dec 2025 is the expected peak (see Image 2).
However, this cycle has shown signs of extension — with ETF inflows, institutional interest, and geopolitical tailwinds delaying a blow-off top. The red price line in the cycle cloud model (Image 1 and 6) shows that Bitcoin is floating in the upper range, but not breaking out — yet. That suggests two things:
- There’s still room for upside, especially if altcoins rally.
- Corrections could be sharper and delayed, driven by complacency or macro events.
The Power Curve in log scale (Image 3) helps us zoom out. From this view, Bitcoin has respected long-term exponential growth even during brutal bear markets.
Meanwhile, the "1–5 years ahead of support" chart (Image 4 and 5) suggests we may still be 1–2 years ahead of the support curve, giving BTC the ability to stay elevated or even surge before gravity kicks in.
Final Thoughts
This cycle might peak in November/December, but nothing is guaranteed — especially in extended macro-driven markets. Still, the data shows we’re nearing a historical inflection point, and the altcoin season (if it happens) could mark the euphoric final leg.


